Volume Monitoring in Kubernetes with Prometheus
Argo workflows create pods and deployments on Kubernetes. When running on AWS, we use EBS for volumes. AWS provides some basic volume metrics but only down to a 5 minute granularity and does not provide any filesystem-level stats, making it hard, for example, to tell how much of the volume capacity was actually being used. To address these issues, we decided to add our own monitoring usingiostats and diskstats.
This blog talks about how we use Prometheus, node-exporter and nsenter to monitor our Kubernetes volumes on AWS.
Setting up Prometheus and node-exporter on Kubernetes is straightforward. We run Prometheus as a deployment and node-exporters as a DaemonSet. Node-exporters can collect operating system metrics from the host. For volume monitoring, we enable two metrics, diskstats and filesystem using the following command as an entrypoint to the node-exporter container.
/bin/node_exporter --collectors.enabled=diskstats,filesystem -collector.procfs /host/proc -collector.sysfs /host/sys -collector.filesystem.ignored-mount-points "^/(sys|proc|host|etc)($|/)"We use the following Kubernetes spec to deploy Prometheus.
The following spec deploys node-exporter as a DaemonSet.
After setting up Prometheus and node-exporters, we are able to see metrics for any existing volumes mounted on the various Kubernetes minion nodes. However, we quickly found out that any new volumes are not showing up in the Prometheus monitoring metrics. After some investigation, we found that when a container starts, it inherits a cloned copy of host’s kernel mount namespace, but this copy is not updated as new volumes are mounted. Thus, any new volumes mounted after node-exporter starts will not be visible to node-exporter.
To get around the mount namespace problem, we need a way to escape the node-exporter’s namespace and get into the host’s namespace. This leads us to nsenter.
nsenter allows us to enter any existing namespace. In this case, we will enter the host namespace to see the up-to-date mount info. For example, instead of running df commands in the namespace of the current container to get the mount info, we will run the following command:
# -t 1 => host (pid=1) namespace
# -m   => mount namespacensenter -t 1 -m df
Please note hostPID=True is required in the node-exporter spec to access the host’s namespace.
Putting it all together
To put it all together, we need to modify the Dockerfile of the node-exporter, which will now be based on the jpetazzo/nsenter image.
We also need to rewrite the node-exporter code to usensenter when collecting filesystem and diskstats metrics. You can find my changes here. We also have the modified node-exporter docker image here.
After all this work, we can finally monitor the volumes on a Kubernetes node! Let’s run some Argo workflows showing how all of this works.
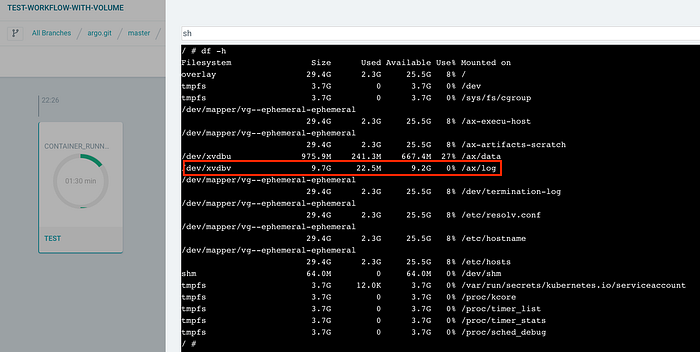
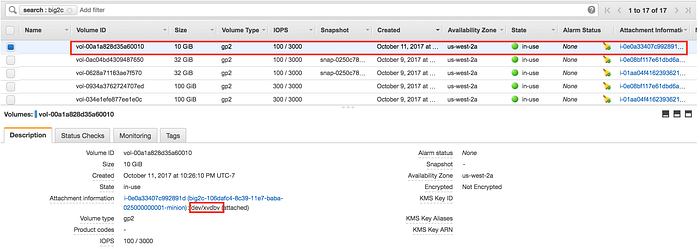
- Start a container using a EBS volume underneath. Shell into the container and you can see the mounted EBS volume.
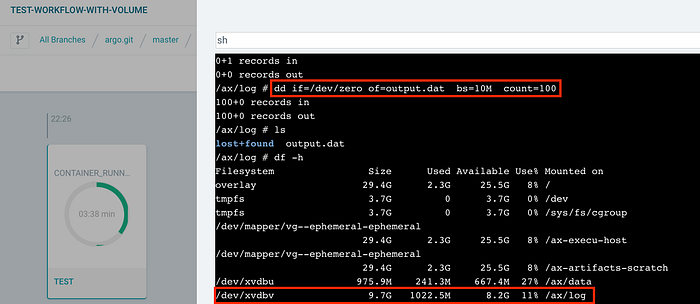
2. Writing a file to the EBS volume
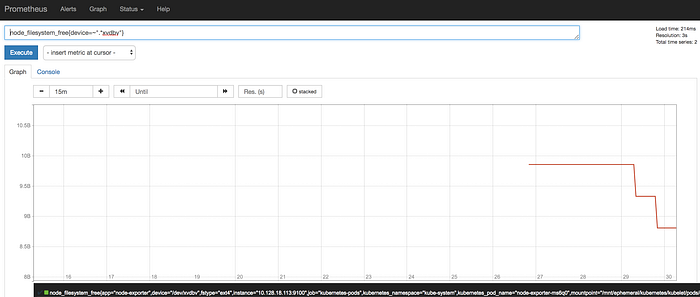
3. Monitor from Prometheus
Summary
In this post, we discussed monitoring volumes on Kubernetes using Prometheus, node-exporter, and nsenter. One disadvantage of this approach is that node-exporter must be run as a privileged container. In the future, it may be better to have Kubelet collect the volume stats so that we can get the stats directly from Kubernetes instead of running node-exporter as a privileged container.
Tianhe Zhang is a member of the technical staff at Applatix, a startup committed to helping users realize the value of containers and Kubernetes in their day-to-day work.